Page Not Found
Sorry, page not found. Read more

A list of all the posts and pages found on the site. For you robots out there is an XML version available for digesting as well.
Sorry, page not found. Read more
About me Read more
Published:
A pleasant read with a reasonably balanced perspective, which provides useful references. Read more
Published:
Excited about this? Coming soon. Read more
Published:
This was part of the GeoComputation Session. Read more
Published:
This paper is about using the literate programming paradigm on migration metrics. Read more
Recommended citation: Buyuklieva, B. and Dennett, A. (2018). Quick and Easy Recipes for Healthy Migration Research. In Conference Proceedings GISRUK 2018, GeoComputation Session, University of Leicester
Published:
This was part of the Symposium on New Horizons in Human Dynamics Research: Innovations in Urban Analytics. Read more
Published:
This was part of the ICRI Urban IoT*. Read more
|MAR: Assembling physical objects by virtual information Published:
venue: “The 4th ACM International Symposium on Pervasive Displays” Read more
Published:
Created with Dr David McCollum and others from the PopGeog Research group for the Population Geography 50th Anniversary Festival. Read more
Made for the CASA charity baking competition 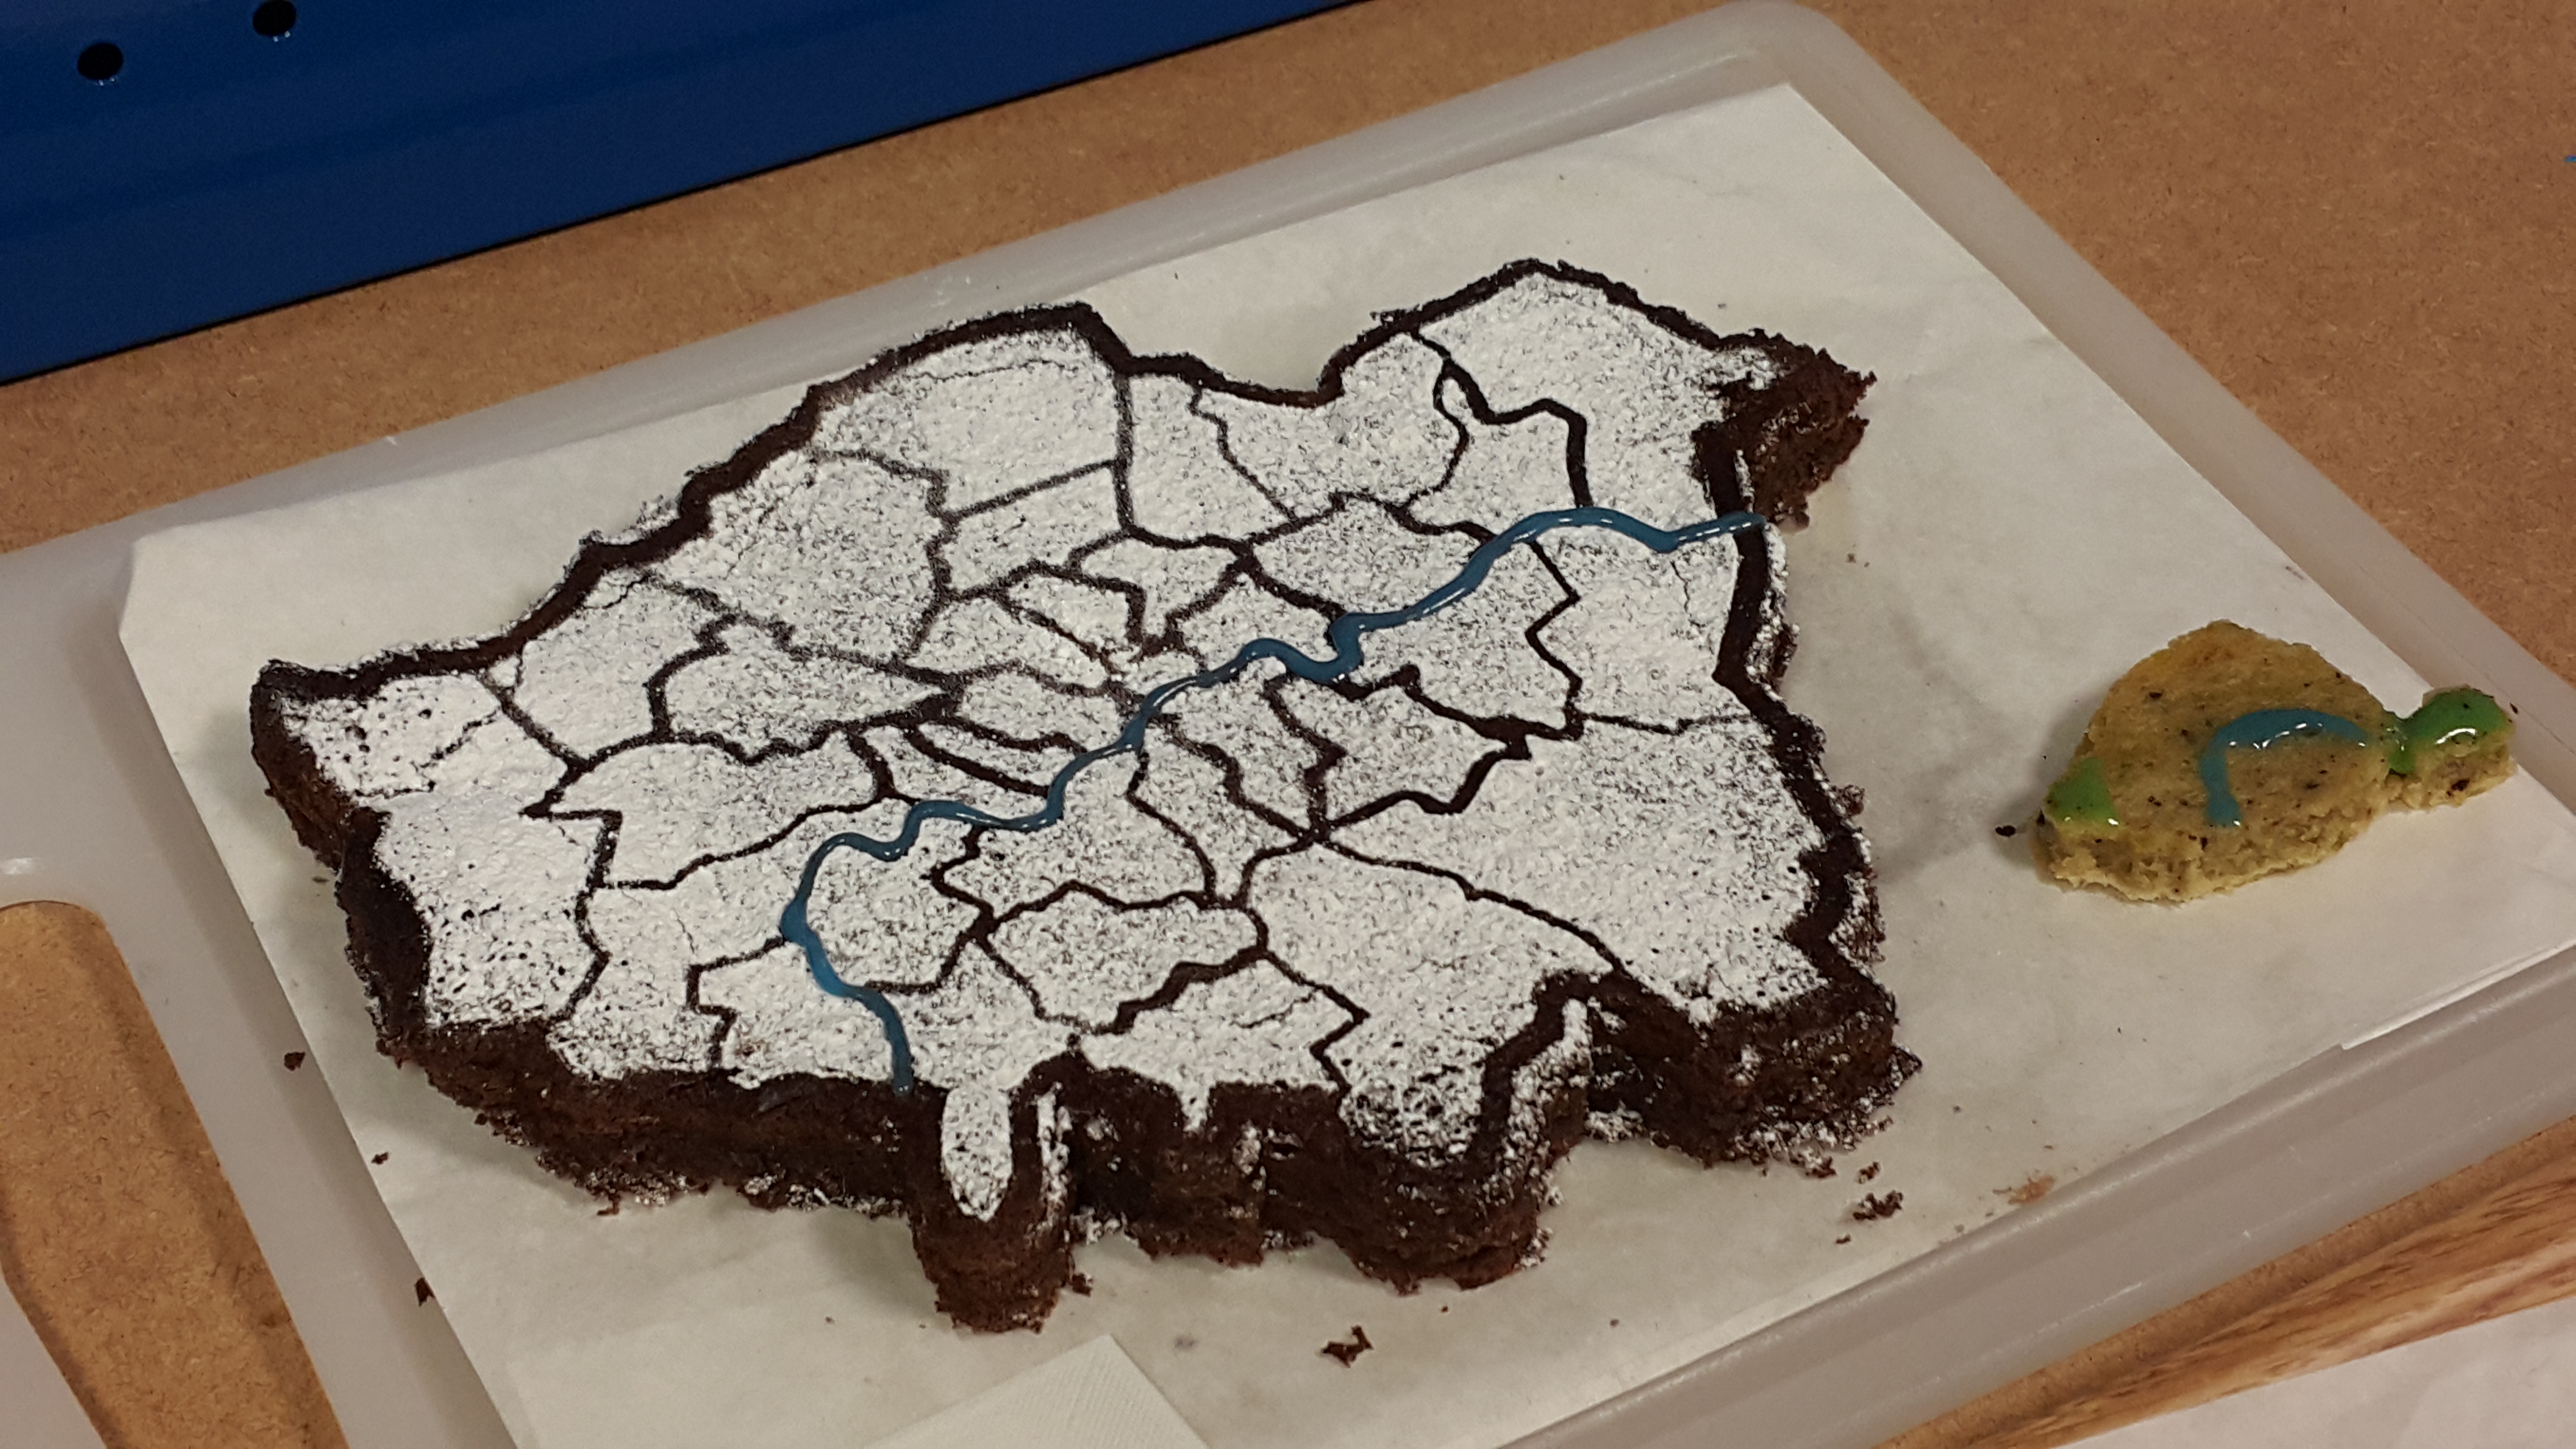 Read more
Made to fit the TI Sensor Tag and a Solar Panel  Read more
Made for Data Visualisation 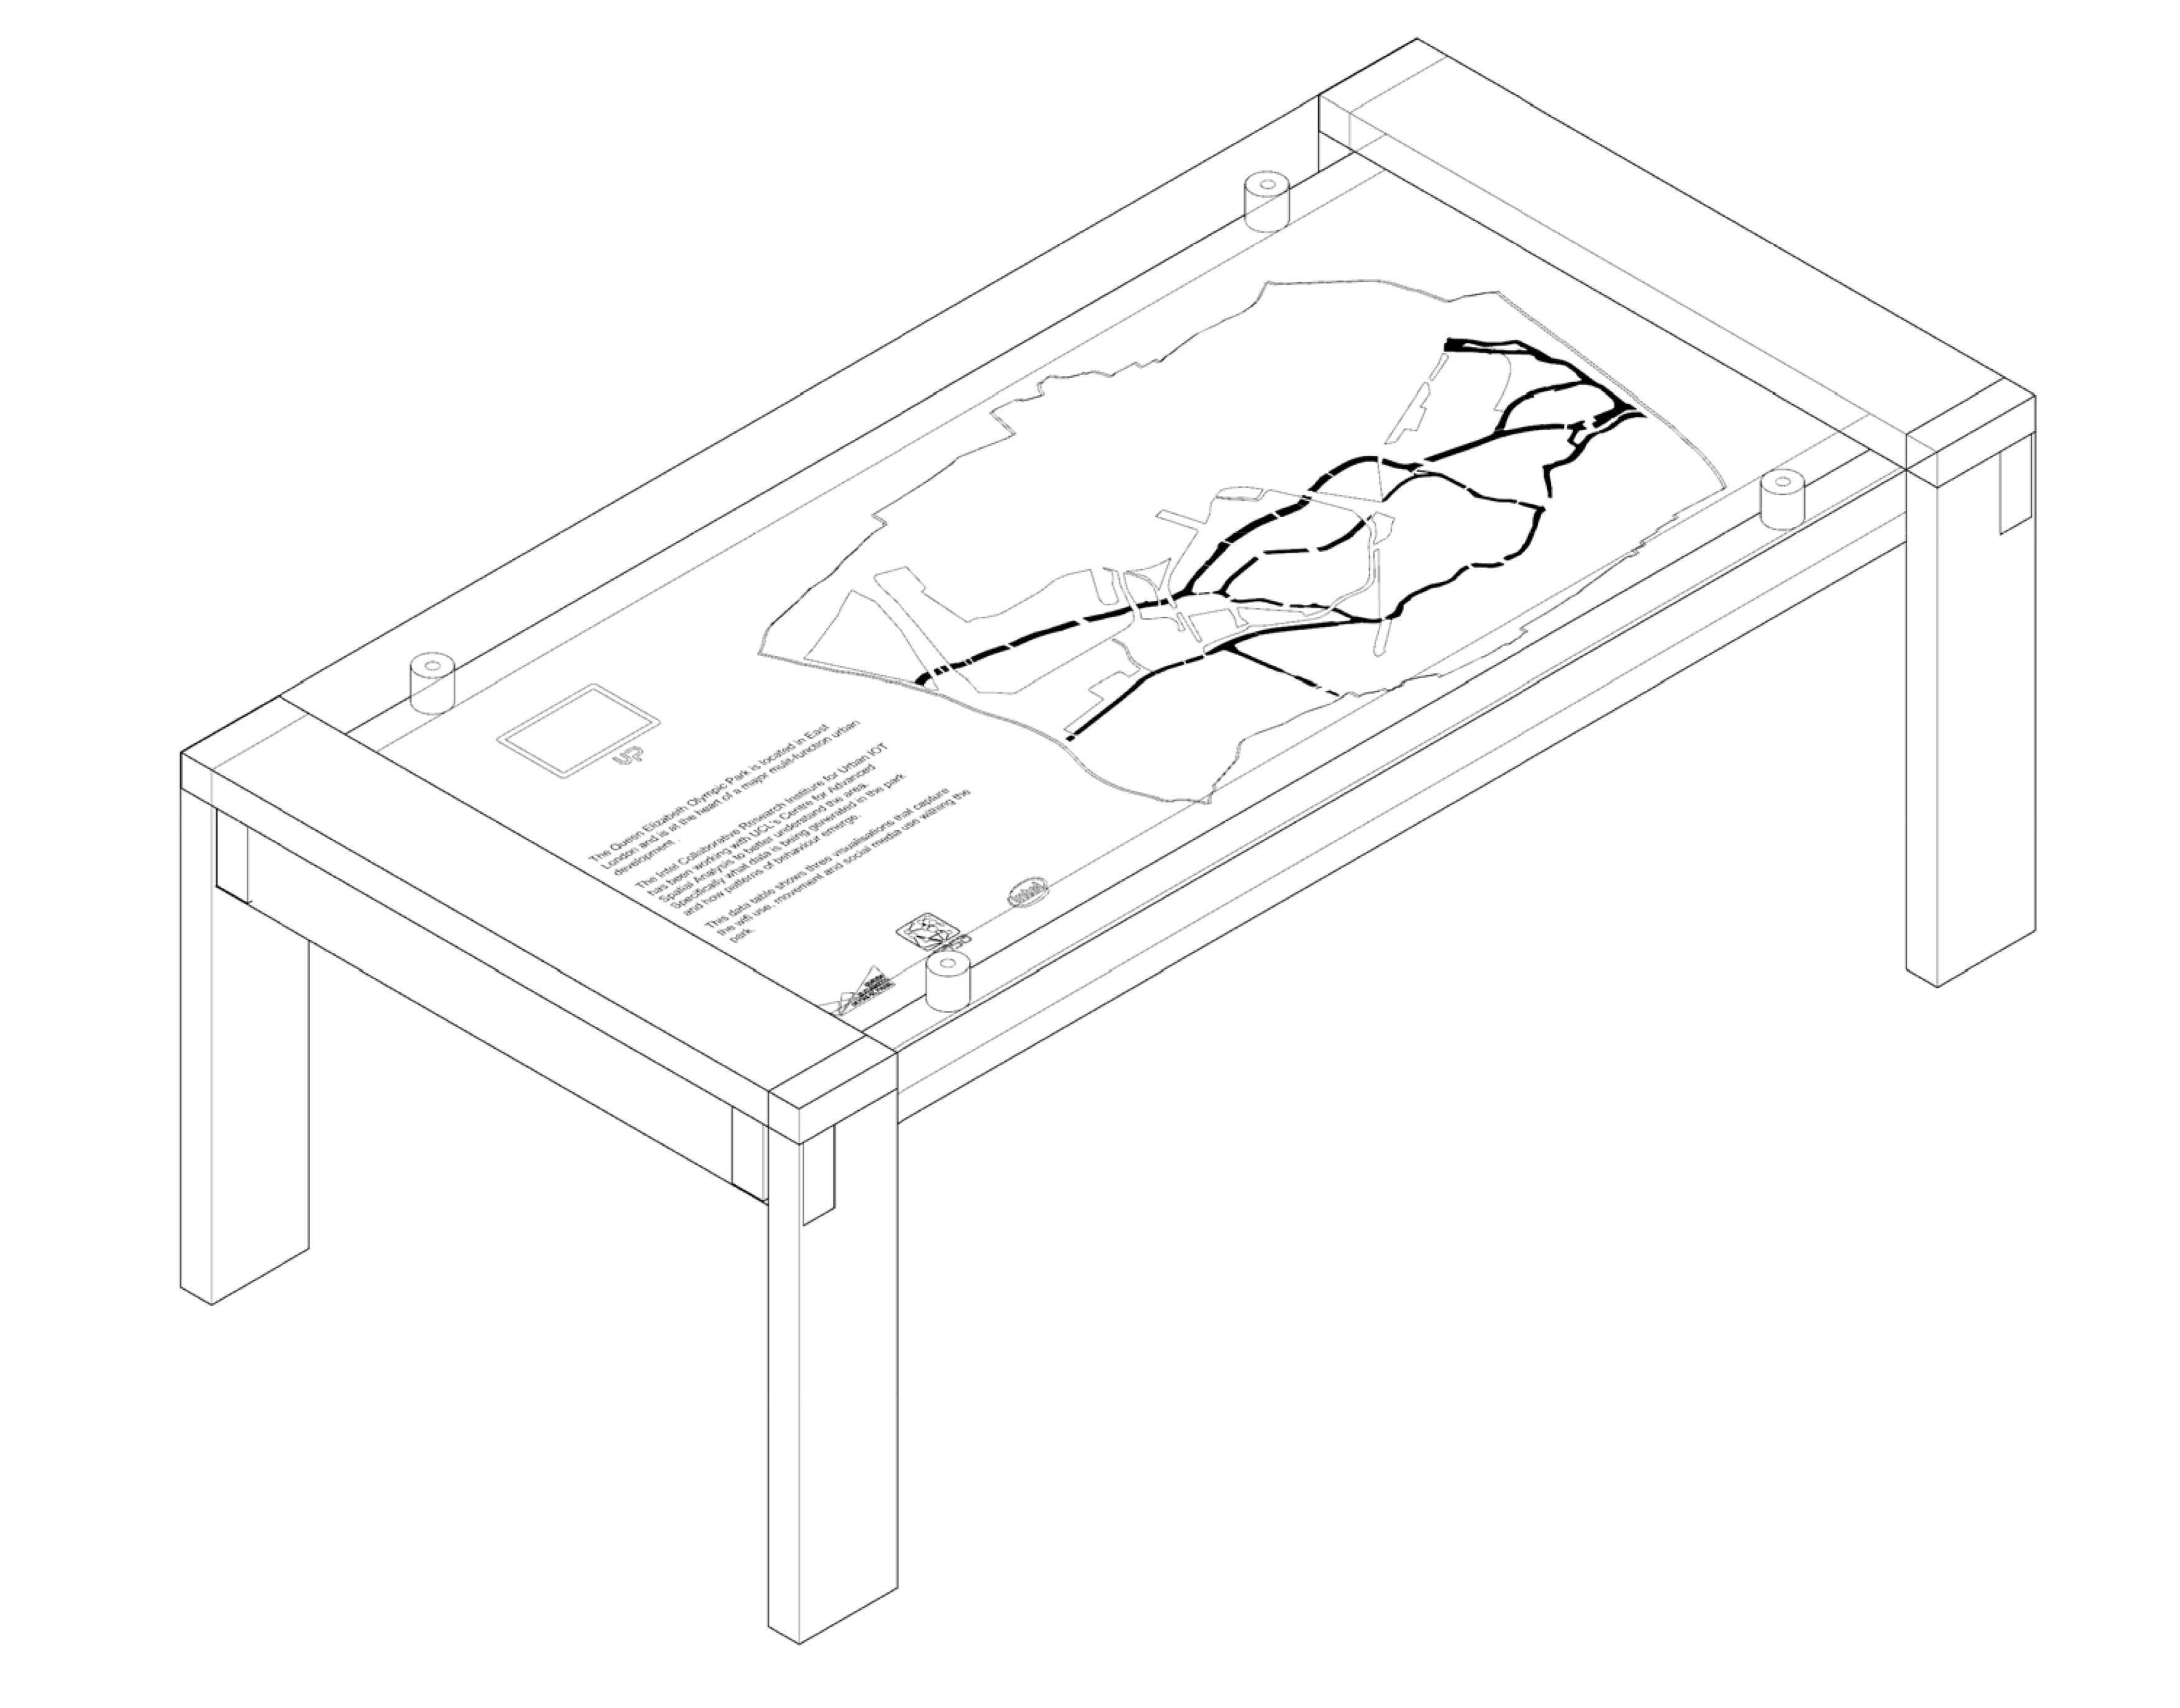 Read more
Published in , 2019
Communter rail plays an important role in land-value uplift, house prices and therefore household residential relocation. Below are commuter stations serving five major English cities within 45 minutes. Destination entry stations (in red) outline the main employment centres of each city region: Read more
Published in Chapter 6, 2021
This work from Chapter 6 is motivated by a desire to address the following questions: (1) how can mobility be understood as a characteristic of a place over time? (2) what are national the ripple effects of large global cities, such as London, in terms of population density and transience? (3) What are the relationships between population density and transience across five decades? To address both questions, this analysis uses historic, spatial data for the period 1971−2011 to create a relative temporal classification of small area geographies in England and Wales. This analysis provides an accessible benchmark for understanding the impact of mobility and development on places and is important for numerically grounded discussions of local inequality and polarisation. Read more
Published in Chapter 6, 2021
This analysis classifies places in terms of population stability and density using quartiles and outliers. It does so by sorting all values into three main categories (low, average, high), with two additional categories for very low and very high cases (based on Tukey fences as used in Chapter 3). This is done because the continuous measures are spread across different ranges due to the differing spatial unit resolutions of the census throughout time and therefore, cannot be compared directly. Labels of high, average and low area used to compare places over different decades. Average values are defined as those within the interquartile range – otherwise stated, the range that contains fifty percent of the data that falls between the 25th and 75th percentile. The virtue of this approach is that it allows for a data-driven, yet simple and clear and most importantly comparable understanding of what is low or high. ‘Low’ denotes values that are lower than half of the observations; in the same spirit, ‘high’ denotes values that are higher than fifty percent of the data. Read more
Published in Chapter 6, 2021
These are my notes on modern UK history. I’ve compilied these to understand how the context of residential arrangments have changed in the UK over time. This may or might not work, as I am still developing the timeline. Read more
University courses, UCL, 2017
I have been a post-graduate teaching assistant in the following courses: Read more
PhD Summer School, UCL, 2019
I was the grant holder and lead organiser of the SSASM19 PhD summer school. Read more